
Quantitative Risk Assessment (QRA) for an LNG Storage Facility
Overview
Mayford performed a Quantitative Risk Assessment (QRA) in accordance with EN 1473, API 752, and NFPA 59A for a 160,000 m³ LNG storage terminal undergoing a capacity expansion in the GCC region. Using PHAST and SAFETI consequence modelling tools, the team evaluated 36 release scenarios covering pool fires, jet fires, flash fires, vapor cloud explosions (VCE), and cryogenic spill dispersion. The assessment quantified individual risk contours and societal risk (F-N curves) that directly informed facility layout modifications, emergency response zone sizing, and the spacing of the new storage tanks from property boundaries and occupied buildings.
The Challenge
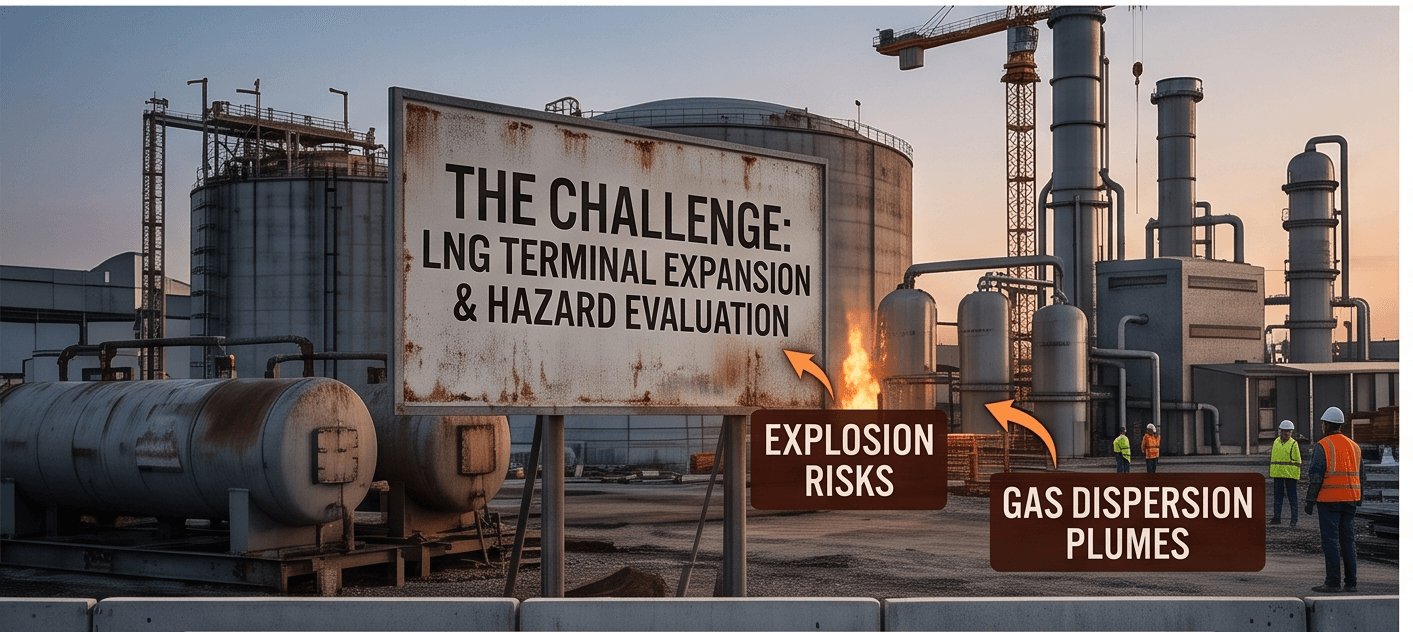
The client planned to add two new 80,000 m³ full-containment LNG tanks adjacent to an existing operational terminal. The expansion brought the facility boundary closer to a public road corridor and a neighboring industrial zone. Local regulatory authorities required a full QRA demonstrating that individual risk levels at the nearest occupied building remained below 1×10⁻⁶ per year, and that societal risk fell within the ALARP region. The existing facility's emergency response plan and firewater system had been designed for the original single-tank configuration and needed reassessment for the expanded layout.

Our Solution
Mayford developed a comprehensive release scenario inventory covering 36 cases across small, medium, and catastrophic bore sizes for LNG process piping, loading arms, tank connections, and boil-off gas systems. Consequence modelling was performed using DNV PHAST to determine thermal radiation zones, overpressure contours, and flammable gas dispersion distances under multiple atmospheric stability classes (Pasquill-Gifford D and F conditions). Frequency analysis used industry failure rate databases (IOGP 434, Purple Book) combined with site-specific equipment counts. Individual risk contours were plotted at 1×10⁻⁵, 1×10⁻⁶, and 1×10⁻⁷ per year, and societal risk was assessed against the client's corporate risk acceptance criteria using F-N curves.